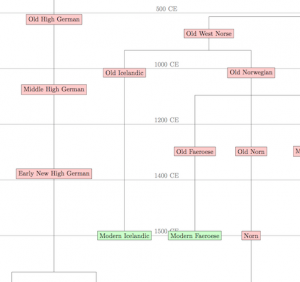
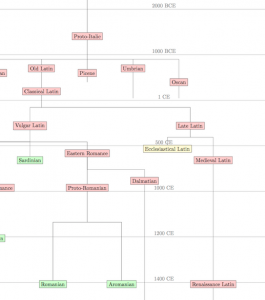
Other people make and eat massive amounts of food over the Thanksgiving weekend. I did that, too, but I also made a chart. A big-ass chart.
There are many ways to chart a language family. You can do the traditional tree view showing genetic relationships. You can show a map of the distribution of various languages and subfamilies. You can view each one individually in terms of its internal history.
Inspired by a brief discussion on Tumblr, I attempted to do all three. Someone asked what Germanic languages were contemporaneous with Latin. I found out the answer, but not before having to read through three Wikipedia articles. I started thinking about ways to represent such a question graphically and came up with this (previews below).
 |
 |
Done in LaTeX, the linguist’s best friend, I attempted to capture the genetic relationships between the various Indo-European languages, the relative locations they occupied in the Indo-European sprachraum (at least before the age of exploration), and the time periods in which each language flourished.
How to read this chart:
- Languages on a red background are extinct.
- Languages on a green background are still extant.
- Languages on a yellow background have no native speakers but are still in use as liturgical or scholarly languages in certain traditions.
- Read from left to right, the chart shows the languages from west to east based on the center of each one’s speaking area (i.e. Celtic is the westernmost subfamily, Tocharian the easternmost). If two languages occupied the same longitudinal area within their subgroup, the more northerly one is on the left and the more southerly one is on the right (thus Baltic is to the left of Slavic, since they occupied more or less the same east-west area, but Baltic is on average more northerly).
- The date at which the language first appears on the chart is the date at which linguists hypothesize that language existed as a distinct idiom. This may be the same as the date of first attestation, but is not necessarily, especially with the older languages. With some of those, the date is rather speculative.
- When a language’s children appear on the chart, you can assume that the parent language went extinct at about that point. If a language had no living children, the line extends downward from that language to the point of extinction.
- The time-scale is very loosely logarithmic; centuries pass much slower as you get to the bottom of the chart.
I chose Indo-European to try this on as it’s the language family I’m most familiar with (I think all but one of the languages I know much of anything about are Indo-European), and because most branches and subfamilies have been well-placed in space and time at this point. I assumed the Pontic-Caspian hypothesis of Indo-European origins; quite simply, it’s the one that makes the most sense to me and the date it gives also allowed the time scale to look reasonable in chart form.
This chart doesn’t include all the Indo-European languages–that would take forever and many of the smaller ones we don’t know much about (the Slavic family alone would take weeks to catalogue), but I think you can get a good picture of when and where diversifications happened within the Indo-European family of languages.
Full version here: 8267×1426 px

UPDATE:
Fixed a few errors: added Romani, Romansh, fixed left-right direction of Eastern Iranian branch, status of Classical Armenian, spelling errors
